How Do You Measure Your ‘Energy Footprint’?
Images: Robin Kent
How does a plastics manufacturer who wants to be environmentally responsible measure a plant’s or firm’s progress toward that goal?
As one attempt to answer that question, I recently tackled the daunting subject of carbon footprints. I find it daunting because of the breadth and depth of research required. It seems like what my father used to call “wrestling a cotton octopus”—the more you try to wrap your arms around its various tentacles, the more it bulges out somewhere else.
I’m following up here with a different solution for measuring your plant’s environmental impact. Called specific energy consumption, or kWh/kg of resin processed, it’s more often cited by European than American sources, at least for now. Unlike carbon footprints, it’s something that’s easy to grasp, directly related to your day-to-day business, and something that’s more or less under your control.
When I say, “easy to grasp,” that does not mean that there aren’t potential pitfalls for the unwary. We explored this topic in four articles by consultant Dr. Robin Kent from February to July 2009 (see Read Next listings at left). The subject is also covered in Dr. Kent’s very useful new book, Sustainability Management in Plastics Processing.
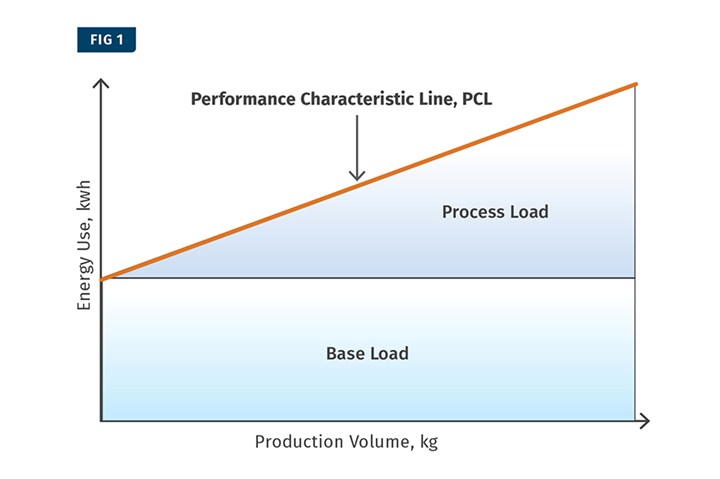
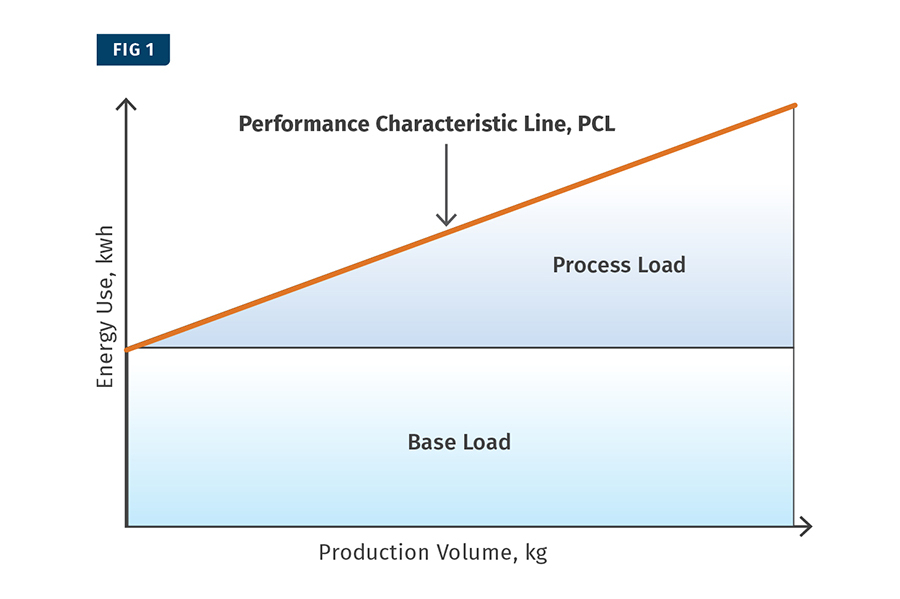
Dr. Kent provides guidance on how to calculate specific energy consumption (SEC) properly and how to avoid one major pitfall that could give you a false sense of achievement. The important thing to keep in mind, Kent advises, is that SEC has two components—a base load, which is a fixed “energy overhead,” and a variable component, which constitutes the slope of the Performance Characteristic Line (PCL) in a graph of SEC vs. production volume in kg (Fig. 1). The fixed base load is consumed by lighting, heating, compressed-air leakage, etc. The base load is consumed even when no production is occurring, and it is unaffected by the level of production. A lower base load is a sign of more efficient operation.
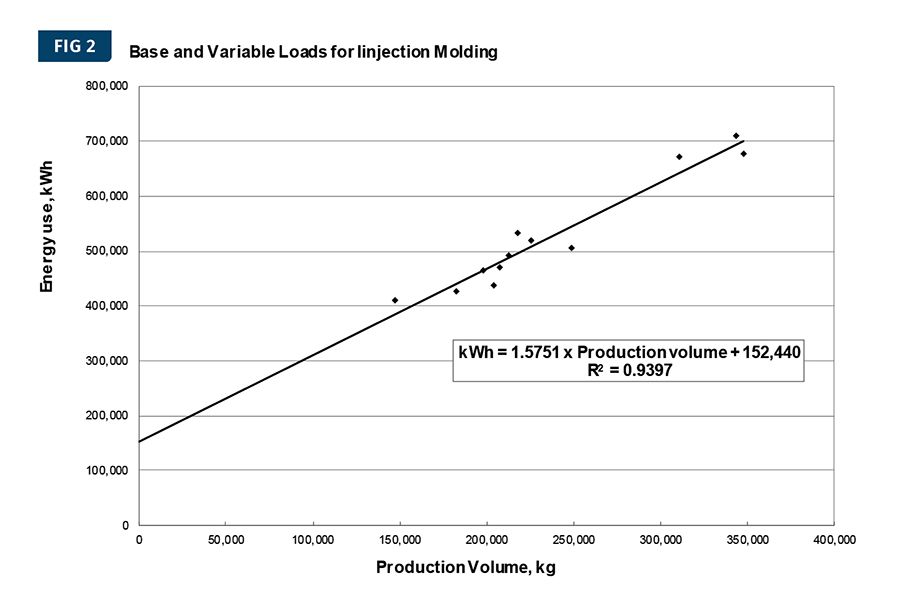
The process load is energy load that is directly related to the production volume. The PCL is the curve of energy consumption vs. production volume. The slope of the statistical “best fit” straight line through those points (PCL) indicates how sensitive your energy consumption is to production volume and therefore how much potential you may have for improvement (Fig. 2). Where the PCL crosses the Y axis at zero production indicates the base load. Dr. Kent warns that a high base load can artificially lower the slope of the PCL.
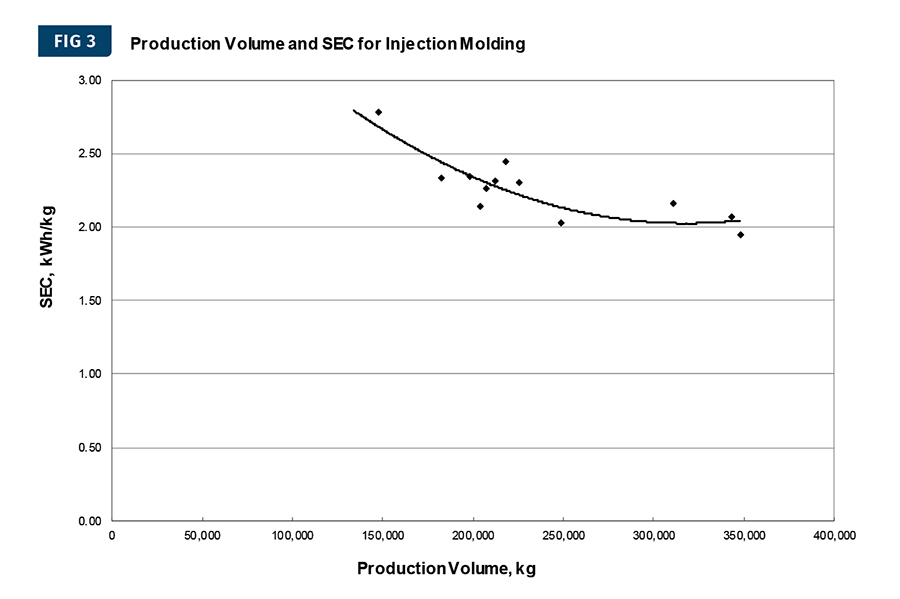
The most obvious mistake a processor can make is to simply measure a weekly or monthly average SEC and compare it with previous performance. The lower the production volume, the greater the influence of the base load on the overall SEC and vice versa (Fig. 3). As Dr. Kent says, “Increasing the production volume will automatically reduce the SEC because the base load will be amortized over a greater production volume and lead to the impression that energy efficiency is improving. This is not an issue when production volumes are rising. There is a decreasing SEC and the production managers can accept congratulations for doing nothing at all. When production volumes are decreasing and the SEC is increasing despite their efforts, then they are less happy to accept the criticism.”
The solution is to prepare a graph according to Dr. Kent’s instructions and compare current energy-consumption and production-volume data to the slope of the PCL. If the data are consistently below the PCL, your energy efficiency is indeed improving. If maintained over a period of time, you should be able to plot a new PCL of lower slope than before.
Dr. Kent also provides cautionary notes on the use of SEC curves for internal and external benchmarking. “Curves like Fig. 2 are very sensitive to changes in monthly performance and can be used for internal monitoring and targeting of individual sites on a monthly or weekly basis. They are essential in setting the targets for energy performance and measure how a plant performed against its own previous internal performance. However, they cannot be used to compare plants because the values depend on things like how big the electrical services are, what types of machines are used, etc.” He also does not recommend using such curves to compare different machines, but rather to compare current vs. past performance for a particular machine.
Read: Engel to Showcase Sustainability at K 2022
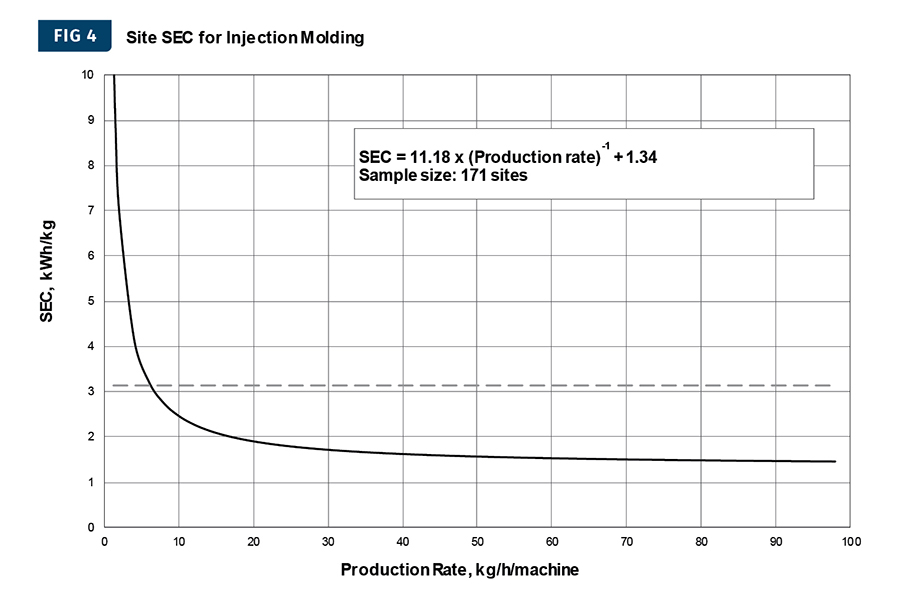
For external benchmarking, Dr. Kent recommends a graph similar to Fig. 4 of SEC vs. production rate (kg/hr per plant or machine). Such curves, he says, “are less sensitive to changes in monthly performance or production volume. They are therefore not useful as monthly performance metrics. They should only be used for external benchmarking at the plant or machine level (measuring how a plant or machine performed against other plants or machines) on a yearly basis to even out the effect of monthly or weekly changes in production volume.”
By the way, as a footnote to my previous blog on carbon footprints, see here for a report on a new study by Arburg on the energy footprint of an injection machine when it arrives at your plant.
Leave a Reply