Microplastic Flows in the Water Cycle
The most lasting achievement of the human species may be the relocation of massive amounts of material from earth’s crust. We’re removing phosphorous and nitrogen from soil and rocks and depositing it in the ocean. We mine metals and stone and place them here and there in clumps on the surface. And, of course, we are bringing fossil fuels to the earth’s surface and turning them into greenhouse gases and, on a smaller scale, microplastics.
From a society’s viewpoint, these activities are incidental the businesses of construction, production, and agriculture, but the scale makes them significant. If we were able to look forward far enough, we might see nothing left of us but a geologic stratum with really weird chemical distribution.
According to an OECD report, global plastic production reached 460 million metric tons in 2019. It’s not too surprising, then, that plastic is detected almost everywhere it is sought, including some places that people have an aversion to finding plastic in, such as their blood.
However trends in overall production and recycling rates interact with future leakage rates, it seems safe to say levels of microplastics in water will continue to increase, at least for a while.
Primary Microplastics
Primary microplastics are pieces that are already less than 5 mm in size when they escape from the production/consumption/waste management system. This includes the bits of tire and other particulates that washed off of roads or suspended by wind, polyester fibers from clothing and other textiles, and even bits that escape supply chains during transport.
A 2017 IUCN report, by Boucher and Friot, uses a model to give proportions on the relative contributions of primary microplastic sources. Their central scenario estimated the main contributors as 34.8% from synthetic textiles, 28.3% from tire erosion, and 24.2% from general “city dust”. Smaller contributions were from road markings, marine coatings, personal care products, and pellets.
The denominator for these ratios is the total amount of primary microplastics, not the total amount of microplastics in the ocean. The IUCN report has been misquoted by everything from tweets to peer-reviewed research papers. It estimates the contribution of primary sources at 15-31% of the total. Of course, all of these numbers are likely to vary a great deal geographically.
Secondary Microplastics
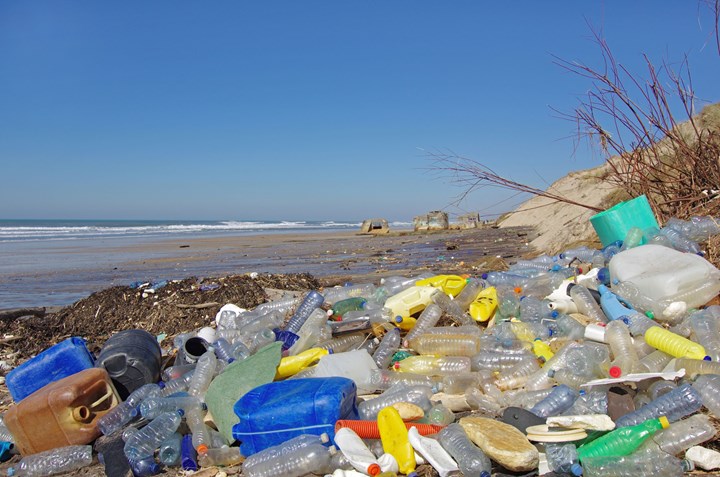
Secondary microplastics come from macroplastics, anything larger than 5 mm, which break down into smaller pieces when exposed to light, heat, organisms, etc. The most visible plastic pollution is macroplastics transitioning to secondary microplastics. It can be washed out of open dumps, fall off a boat, or be gear intended for marine use, such as fishing nets.

A site of exceptionally poor material management. The visible portion of litter can be the tip of an iceberg.
Photo Credit: Thinkstock
The question of how much is out there is related to the question of how fast plastics break down in the environment, and that is a tricky one. The reasons are well described in a 2020 review paper from Sustainable Chemistry & Engineering. The authors (Chamas and others from UC Santa Barbara) describe a specific surface degradation rate, which depends on various exposure conditions (not only how much light, heat, etc. but how widely these values change over time), the geometry of the piece of plastic (which also changes over time), and the chemical structure of the material. They wind up with a range in half-lives from 58 to 1200 years, but that read is about the journey.
Whatever the degradation rate for a given piece of plastic, the importance of secondary microplastics could climb even in the absence of further leakage.
Secondary microplastic production is the opportunity for recycling. And not just by directly keeping plastics in the value chain. Waste management systems run the gamut from highly sophisticated with high circularity to nonexistent. If recycling is implemented in an area, chances are that involves a more general upgrade of the waste management system, with a range of benefits for communities.
Leave a Reply